Training
7 QUALITY CONTROL TOOLS
7 Quality Control
Tools training focuses on teaching participants the
foundational quality tools used to analyze, control, and improve processes and
product quality. These tools are widely used in quality management across
industries, providing teams with practical methods for identifying issues,
analyzing data, and making process improvements. The training is ideal for
quality managers, engineers, production supervisors, and others involved in
maintaining and enhancing quality standards.
Here's an overview
of what 7 Quality Control Tools training covers and how it
is typically conducted.
WHAT ARE THE 7 QUALITY
CONTROL TOOLS?
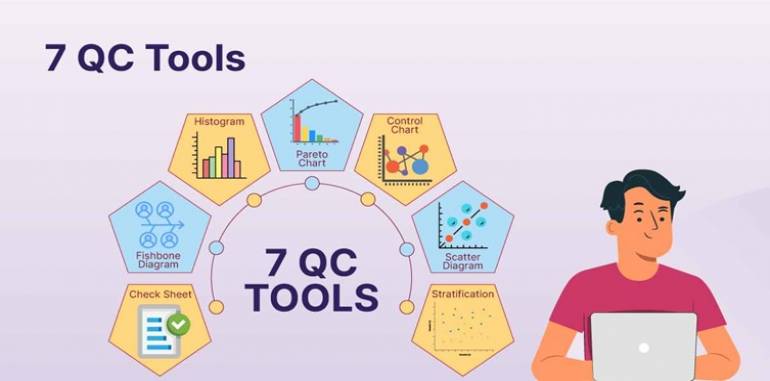
The 7 Quality
Control Tools are a set of graphical and analytical techniques developed
to help identify, analyze, and resolve quality issues systematically. These
tools are:
1.
Cause-and-Effect
Diagram (Ishikawa or Fishbone Diagram) – Helps identify the root causes of a problem.
2.
Check
Sheet – A structured, simple
form used to collect data in real-time.
3.
Control
Chart – Graphs used to study
how a process changes over time.
4.
Histogram – A bar chart that shows the frequency
distribution of data.
5.
Pareto
Chart – Highlights the most
significant factors in a dataset, showing which factors to prioritize.
6.
Scatter
Diagram – Shows the
relationship between two variables to identify correlations.
7.
Flow
Chart (Process Mapping) – Visualizes a process to help identify potential areas for
improvement.
OBJECTIVES OF 7 QUALITY
CONTROL TOOLS TRAINING
1.
Identify
Root Causes of Issues – Teach participants how to identify and categorize causes of
quality issues.
2.
Collect
and Analyze Data –
Equip participants with methods for data collection, analysis, and
interpretation.
3.
Monitor
and Control Processes – Enable participants to use control charts and other tools to
monitor process stability.
4.
Identify
Areas for Improvement – Use data to identify opportunities for reducing defects and
improving quality.
5.
Make
Data-Driven Decisions – Teach participants to use these tools to support
decision-making and improvement efforts.
HOW 7 QUALITY CONTROL
TOOLS TRAINING IS DELIVERED
1. Introduction to
Quality Control and the 7 QC Tools
- Content: Overview of the importance of quality control and the
role of data-driven tools in quality improvement. Brief history and
purpose of each of the 7 QC tools.
- Activities: Group discussion on the value of quality control and
examples of how the tools are used in different industries.
- Outcome: Participants understand the role and importance of the
7 QC tools in maintaining and improving quality.
2. Cause-and-Effect
Diagram (Fishbone/Ishikawa)
- Content: Explanation of the cause-and-effect diagram and its
purpose in identifying root causes of problems.
- Activities: Hands-on exercise where participants create a fishbone
diagram for a given problem (e.g., late deliveries or high defect rates).
- Outcome: Participants learn to use cause-and-effect diagrams to
identify potential causes of quality issues systematically.
3. Check Sheet for Data
Collection
- Content: Introduction to check sheets as a simple data
collection tool, with examples of how they can be customized for various
processes.
- Activities: Participants design and fill out a check sheet for a
sample quality inspection scenario, such as counting defects or recording
equipment failures.
- Outcome: Participants gain practical experience in creating
check sheets to collect data for quality control purposes.
4. Control Chart for
Process Monitoring
- Content: Explanation of control charts and how they are used to
monitor process stability and identify variations.
- Activities: Participants create control charts from sample data,
learning to interpret patterns and determine if a process is in control or
needs corrective action.
- Outcome: Participants understand how to use control charts to
monitor processes and identify when variations are normal or need
investigation.
5. Histogram for Data
Distribution Analysis
- Content: Introduction to histograms and how they are used to
represent the frequency distribution of data.
- Activities: Participants construct a histogram based on provided
data (e.g., time to complete tasks, product dimensions).
- Outcome: Participants learn to create and interpret histograms
to understand data distributions and identify patterns that may indicate
quality issues.
6. Pareto Chart for
Prioritizing Issues
- Content: Explanation of the Pareto Principle (80/20 rule) and
how Pareto charts help focus on the most impactful issues.
- Activities: Participants analyze a set of quality issues and
create a Pareto chart, identifying the top causes of defects or delays.
- Outcome: Participants learn to use Pareto charts to prioritize
issues and focus on the most significant factors affecting quality.
7. Scatter Diagram for
Correlation Analysis
- Content: Overview of scatter diagrams and how they illustrate
relationships between two variables.
- Activities: Participants create a scatter diagram using
sample data (e.g., defect rates vs. operator experience) and analyze
whether there is a correlation.
- Outcome: Participants learn to use scatter diagrams to explore
relationships between variables and identify possible causes of variation.
8. Flow Chart for
Process Mapping and Improvement
- Content: Explanation of flow charts as tools for visualizing
processes, identifying bottlenecks, and improving workflows.
- Activities: Participants map a sample process using a flow chart
and identify potential improvement points.
- Outcome: Participants gain skills in creating flow charts and
identifying areas for process improvement.
TRAINING TECHNIQUES FOR
EFFECTIVE 7 QC TOOLS TRAINING
1.
Interactive
Workshops – Participants work on
real or simulated data, applying each tool to practice the skills learned.
2.
Case
Studies and Examples – Practical examples from different industries help illustrate how
each tool is used to solve quality issues.
3.
Group
Exercises and Discussions – Collaborative exercises enable participants to brainstorm
causes, analyze data, and interpret charts.
4.
Software
Training (Optional) – Training in quality management software (e.g., Minitab, Excel)
for creating diagrams, charts, and visual data representations.
5.
Feedback
and Review – Continuous feedback
during exercises to ensure participants understand each tool and its
application.
BENEFITS OF 7 QUALITY
CONTROL TOOLS TRAINING
1.
Improved
Problem Solving and Root Cause Analysis: Participants can use tools like the fishbone diagram to
systematically address and resolve quality issues.
2.
Better
Data Collection and Analysis: Check sheets and histograms provide a structured approach to
data collection, allowing more accurate analysis and insights.
3.
Enhanced
Process Control: Control charts help
maintain process stability, identifying issues before they impact product
quality.
4.
Informed
Decision-Making: Pareto and scatter
diagrams enable data-driven prioritization and decision-making.
5.
Increased
Efficiency and Process Improvement: Flow charts help visualize and streamline processes, reducing
waste and enhancing workflow efficiency.
6.
Quality
Improvement and Cost Reduction: Identifying and addressing quality issues leads to fewer
defects, reduced rework, and lower operational costs.
In summary, 7 Quality
Control Tools training provides a foundation in essential quality management
techniques, helping organizations maintain high standards and continuously
improve products and processes.
